Using the Dashboard
The dashboard serves as the central hub in Dockflow, providing a bird's eye view of everything happening right now.
Accessing the Dashboard
From the main navigation menu, select Dashboard.
 Figure 1: Dockflow dashboard with shipment status counters and main views
Dashboard Structure
Header Tabs
The header displays shipment status counters representing tradeflows in different phases:
- Click individual tabs to filter tradeflows by phase
- See at-a-glance counts for each status
- Quickly jump to specific shipment categories
Main Views
The dashboard offers several pre-configured views to help you focus on what matters:
Tradeflows
All created tradeflows for your entity. This is your complete list of shipments.
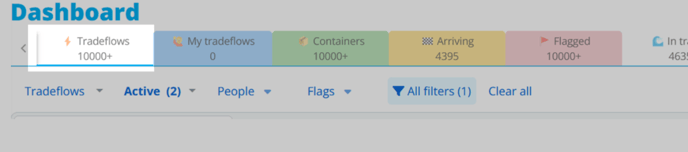 Figure 2: Tradeflows view showing all shipments
My Tradeflows
Only tradeflows where you are the lead contact. Use this to see shipments you're personally responsible for.
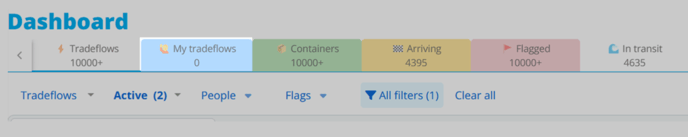 Figure 3: My Tradeflows - shipments where you're the lead contact
Containers
All containers across all tradeflows. View individual container-level details rather than shipment-level summaries.
 Figure 4: Container-level view across all shipments
Arriving
Shipments arriving within a specific time window:
- Yesterday - Shipments that arrived
- Today - Currently arriving
- Next 2 days - Upcoming arrivals
Use this to plan receiving operations and coordinate with warehouses.
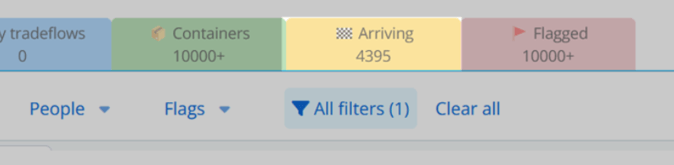 Figure 5: Arriving shipments view
Flagged
Tradeflows with detected disruptions based on user-assigned flags.
Examples of flagged events:
- ETA changes exceeding threshold
- Missing documentation
- Customs delays
- Temperature violations
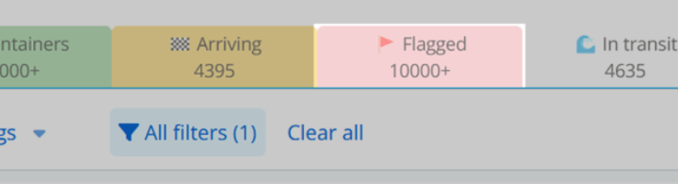 Figure 6: Flagged tradeflows with detected disruptions
In Transit
Shipments currently at sea. Track vessels and containers in-route to their destinations.
 Figure 7: Shipments currently in transit
Temperature
Containers with condition trackers monitoring:
- Temperature
- Humidity
- Shock/impact
- Other environmental conditions
Critical for refrigerated cargo and sensitive goods.
 Figure 8: Containers with temperature and condition tracking
Discharged at POD
Shipments that have arrived and been discharged at the port of destination.
Next step: Arrange pickup or delivery from the port.
 Figure 9: Containers discharged at port of destination
Customization Features
Column Management
Customize which data columns are visible and their order:
- Click the Views option (usually in the top-right)
- Select Edit columns
- Check/uncheck columns to show or hide them
- Drag columns to reorder them
- Click Apply to save your changes
Common columns:
- Container number
- Origin/Destination
- ETA
- Status
- Carrier
- Vessel name
- Lead contact
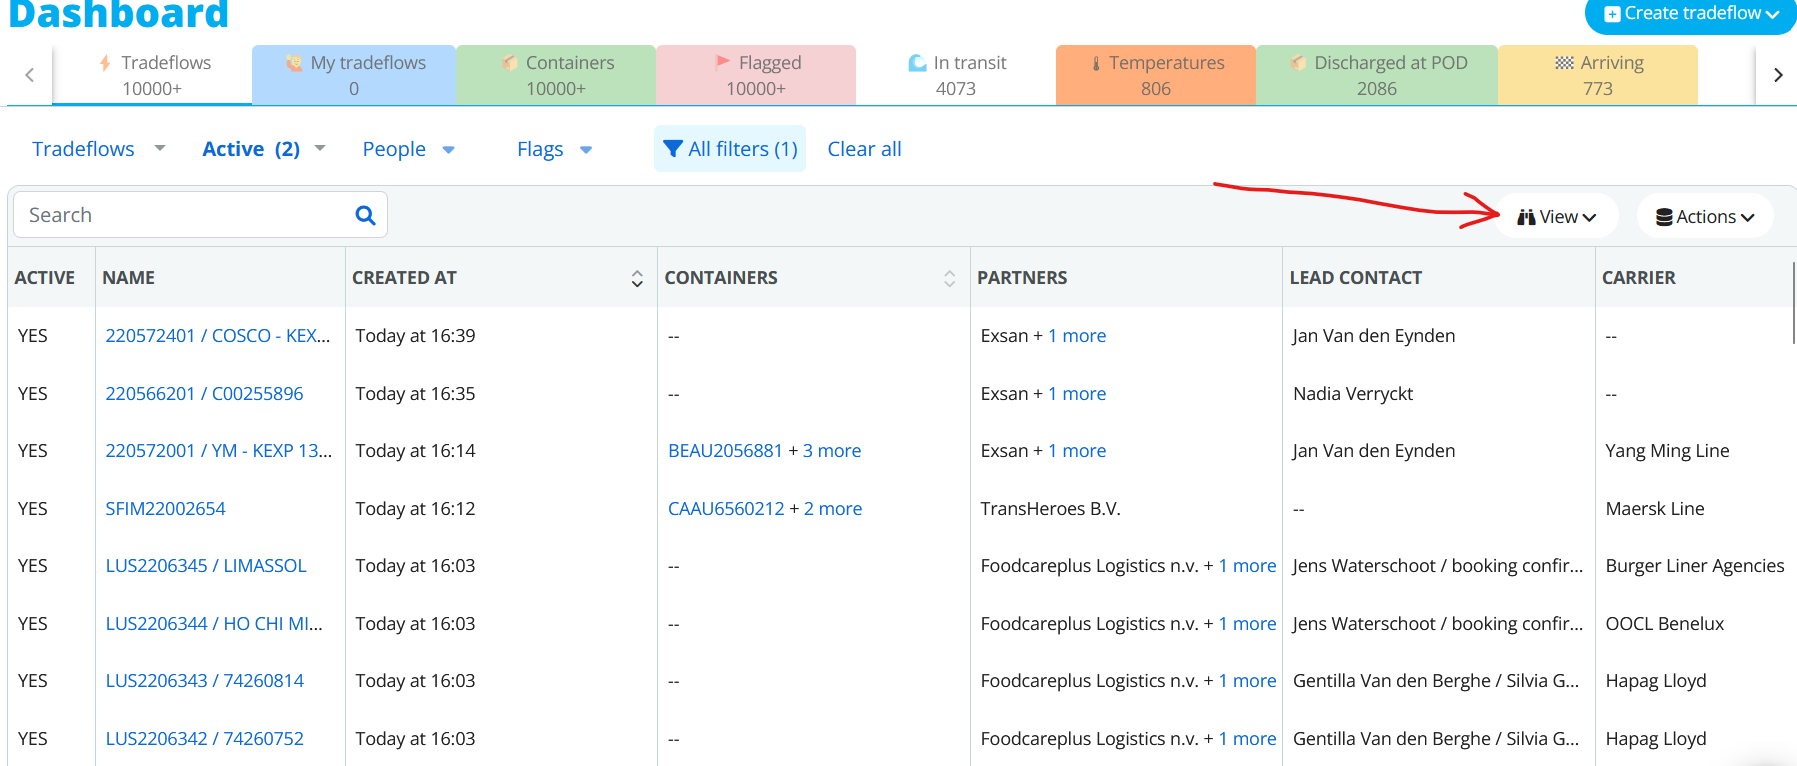 Figure 10: Edit columns interface
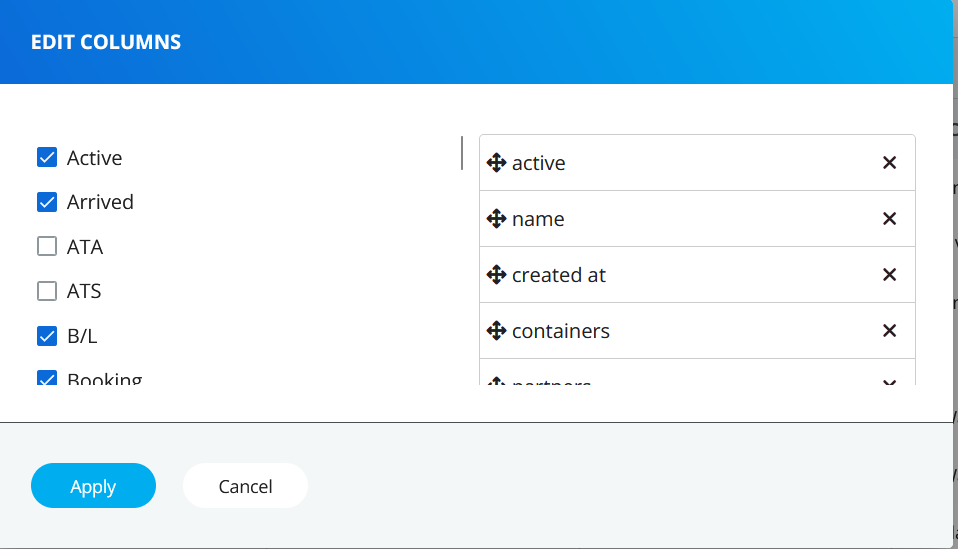 Figure 11: Configure which columns to display
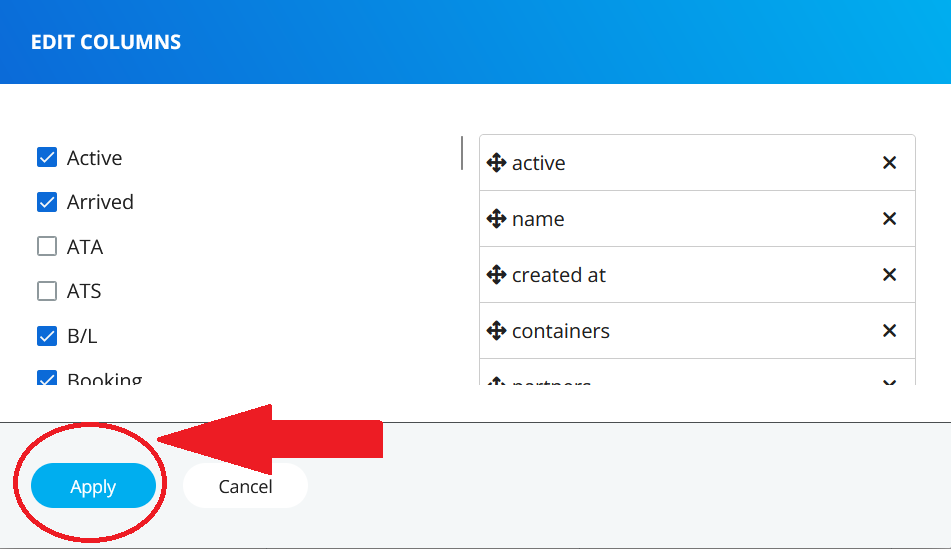 Figure 12: Apply column changes
Creating Custom Views
Save your column configurations and filters as reusable views:
- Click the View menu
- Select "Save & Edit view"
- Configure your columns and filters
- Give your view a descriptive name
- Click Save
Your custom view will now appear in the Views dropdown for quick access.
Example custom views:
- "Urgent - Arriving Today" - Only containers arriving today
- "My Temperature Cargo" - Your refrigerated shipments
- "Partner XYZ Shipments" - All shipments with a specific partner
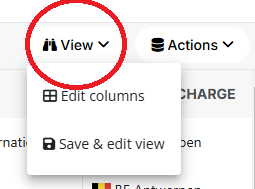 Figure 13: Access the View menu
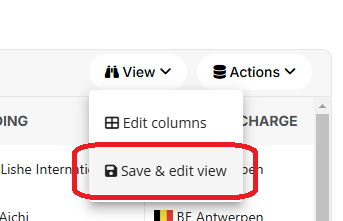 Figure 14: Save & Edit view option
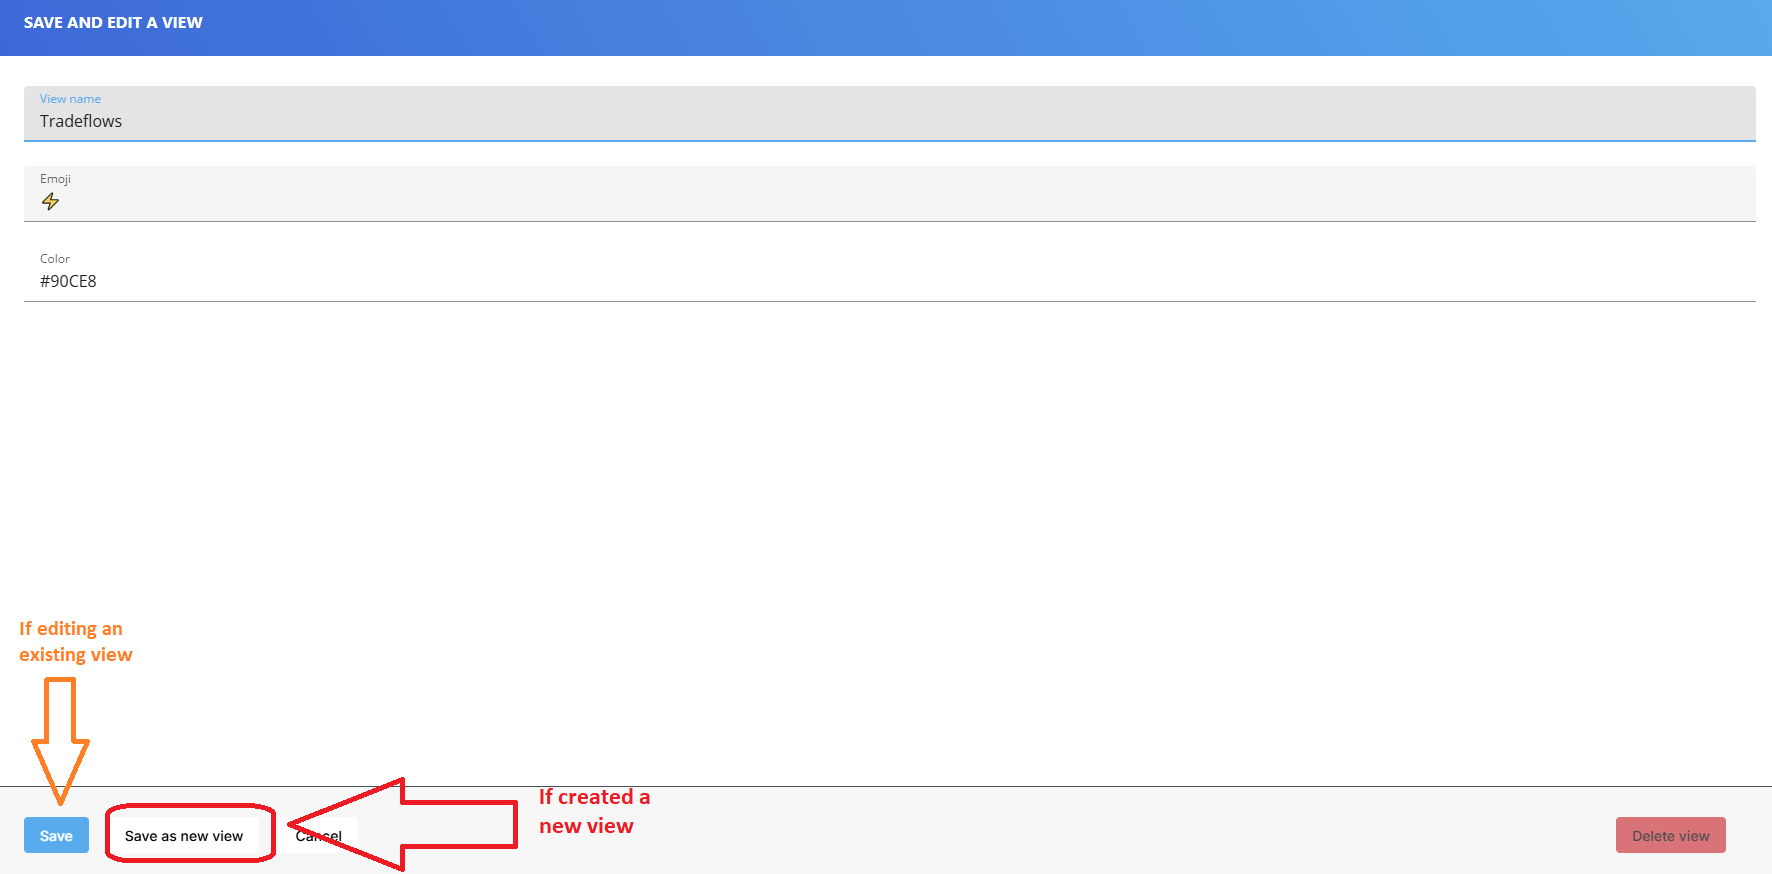 Figure 15: Name and save your custom view
Filtering
Apply multiple filters to narrow down your view:
Available filters:
- Partners - Filter by business partners or forwarders
- Flags - Show only flagged shipments
- Type - Filter by shipment type (FCL, LCL, air, etc.)
- Active/Inactive status - Show only active or archived shipments
- Date ranges - Filter by departure, arrival, or creation dates
- Ports - Filter by origin or destination port
How to use filters:
- Click the Filter button (usually near the search bar)
- Select your filter criteria
- Click Apply
- View filtered results
Clear filters:
- Click Clear all in the filter bar
- Or click the X next to individual filter tags
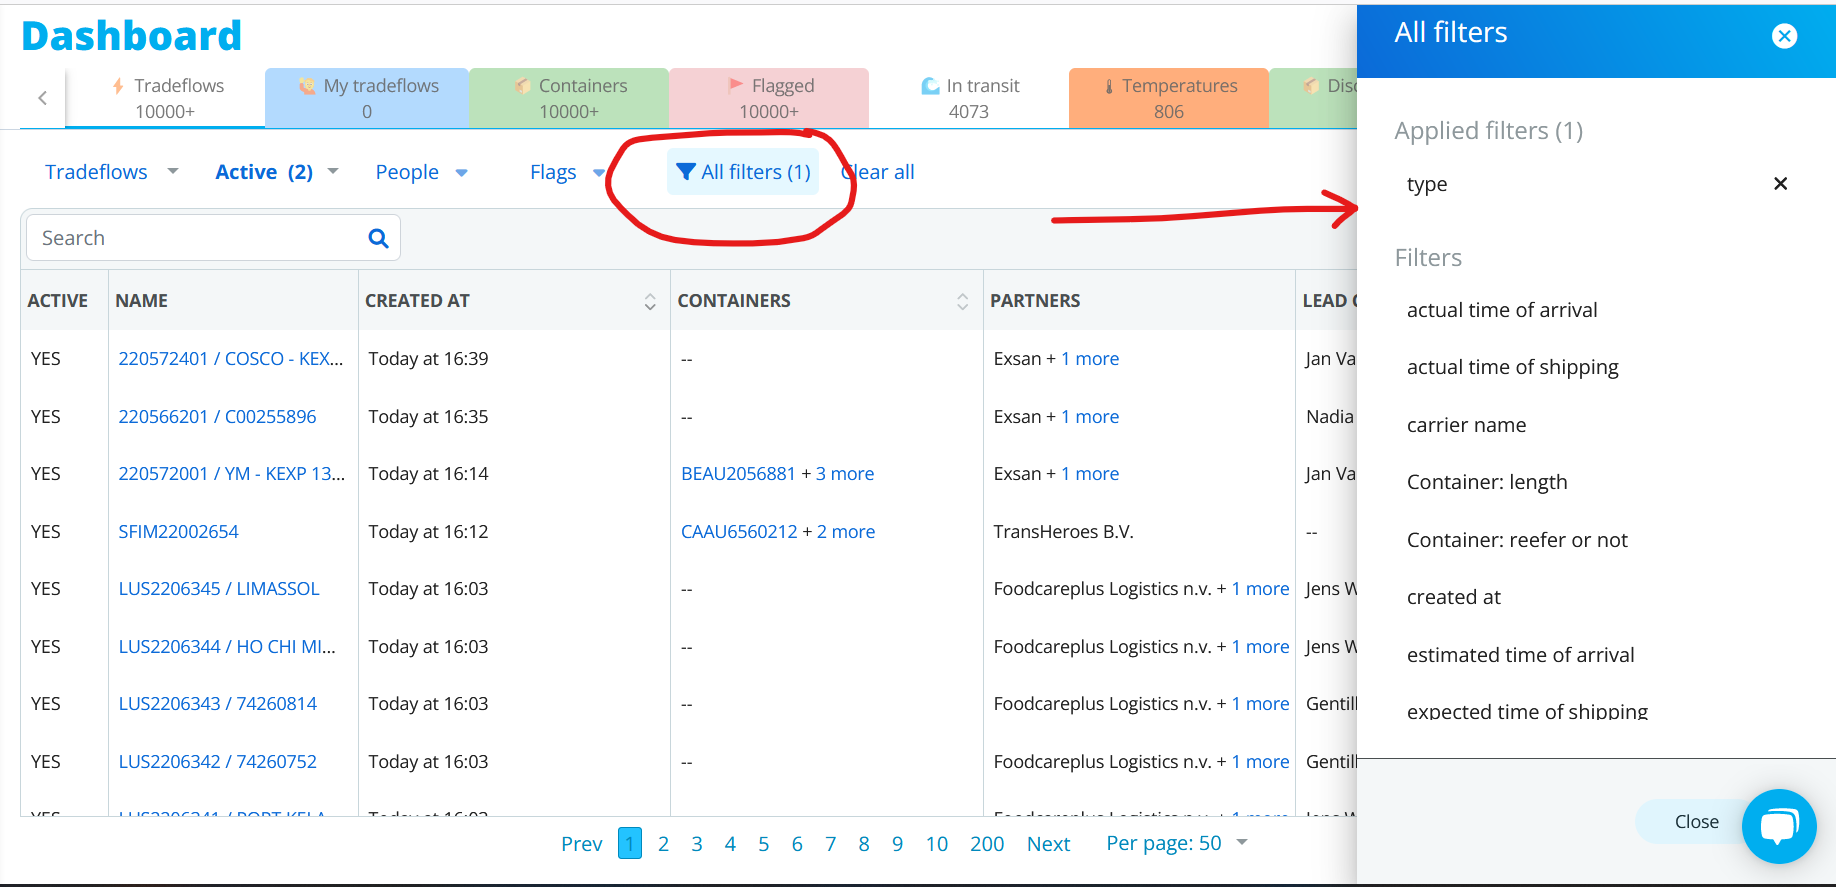 Figure 16: Filter editing and management interface
Tips for Effective Dashboard Use
Combine Views and Filters
Use views for persistent configurations and filters for temporary focus:
Example workflow:
- Start with "My Tradeflows" view
- Apply filter for "Arriving this week"
- Add filter for "Flagged" to see only problematic shipments
- Address issues
- Clear filters to return to full view
Save Common Filter Combinations
If you frequently use the same filter combination:
- Apply your filters
- Save as a custom view
- Reuse instantly from the Views dropdown
Use Multiple Tabs
Open multiple dashboard views in separate browser tabs:
- Tab 1: "Arriving Today" - Check hourly
- Tab 2: "Flagged" - Monitor issues
- Tab 3: "All Tradeflows" - Reference view
Keyboard Shortcuts
Speed up your workflow with keyboard shortcuts:
/- Focus search barEsc- Clear search or close modals- Arrow keys - Navigate between rows
Enter- Open selected tradeflow
(Check the help menu for a complete list of shortcuts)
Next Steps
- Learn about automations - Getting Started with Automations
- Create custom flags - Set up automated alerts for your team
- Export data - Download dashboard data for reporting
Need Help?
- In-app tour - Click the help icon for an interactive dashboard tour
- Video tutorials - Dashboard walkthrough videos (coming soon)
- Email support - [email protected]
Migrated from: https://support.dockflow.com/using-the-dashboard Last updated: January 28, 2026