Using the Dashboard
The dashboard serves as the central hub in Dockflow, providing a bird's eye view of everything happening right now.
Accessing the Dashboard
From the main navigation menu, select Dashboard.
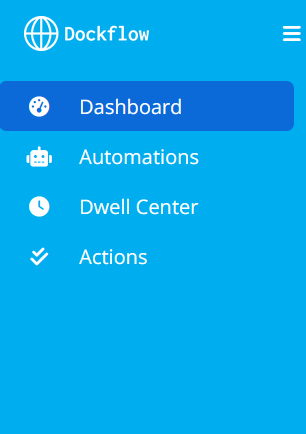 Figure 1: Dockflow dashboard with shipment status counters and main views
Dashboard Structure
Header Tabs
The header displays shipment status counters representing tradeflows in different phases:
- Click individual tabs to filter tradeflows by phase
- See at-a-glance counts for each status
- Quickly jump to specific shipment categories
Main Views
The dashboard offers several pre-configured views to help you focus on what matters:
Tradeflows
All created tradeflows for your entity. This is your complete list of shipments.
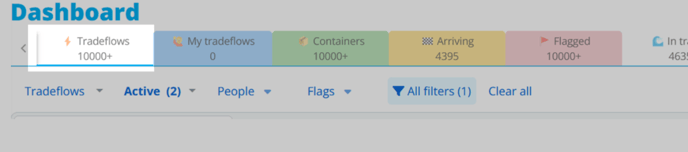 Figure 2: Tradeflows view showing all shipments
My Tradeflows
Only tradeflows where you are the lead contact. Use this to see shipments you're personally responsible for.
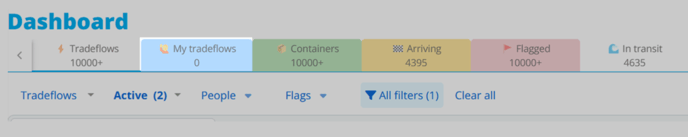 Figure 3: My Tradeflows - shipments where you're the lead contact
Containers
All containers across all tradeflows. View individual container-level details rather than shipment-level summaries.
 Figure 4: Container-level view across all shipments
Arriving
Shipments arriving within a specific time window:
- Yesterday - Shipments that arrived
- Today - Currently arriving
- Next 2 days - Upcoming arrivals
Use this to plan receiving operations and coordinate with warehouses.
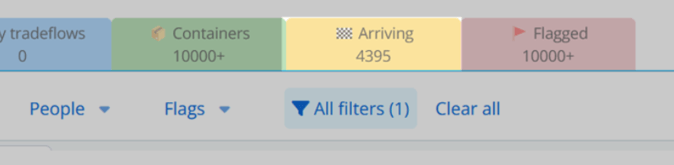 Figure 5: Arriving shipments view
Flags
Open the Flags tab in the dashboard header to see tradeflows that currently have an active flag. Flags are set by automations when their rules match (for example an ETA change or a discharge event). The counter on the tab shows how many flagged rows match your filters.
The table lists each flag with B/L, booking, a name that reflects the automation or flag type (for example NEW ETA CHANGE (+1 days) or ETA Delayed +7 days), and flag created time. Use the filters above the grid (flags, active state, people, and more) to narrow the list. For how automations create these flags and how notifications work, start with Flags overview.
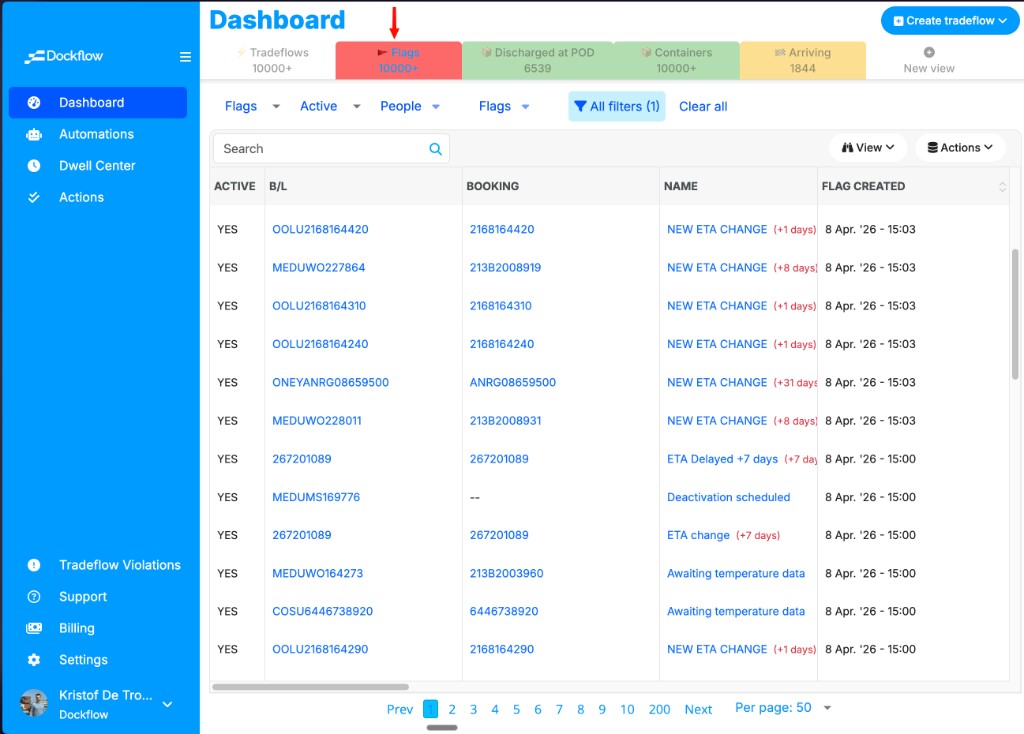 Figure 6: Flags tab—active flags on tradeflows, with B/L, booking, flag name, and created time
In Transit
Shipments currently at sea. Track vessels and containers in-route to their destinations.
 Figure 7: Shipments currently in transit
Temperature
Containers with condition trackers monitoring:
- Temperature
- Humidity
- Shock/impact
- Other environmental conditions
Critical for refrigerated cargo and sensitive goods.
 Figure 8: Containers with temperature and condition tracking
Discharged at POD
Shipments that have arrived and been discharged at the port of destination.
Next step: Arrange pickup or delivery from the port.
 Figure 9: Containers discharged at port of destination
Customization Features
Column Management
Customize which data columns are visible and their order:
- Click the Views option (usually in the top-right)
- Select Edit columns
- Check/uncheck columns to show or hide them
- Drag columns to reorder them
- Click Apply to save your changes
Common columns:
- Container number
- Origin/Destination
- ETA
- Status
- Carrier
- Vessel name
- Lead contact
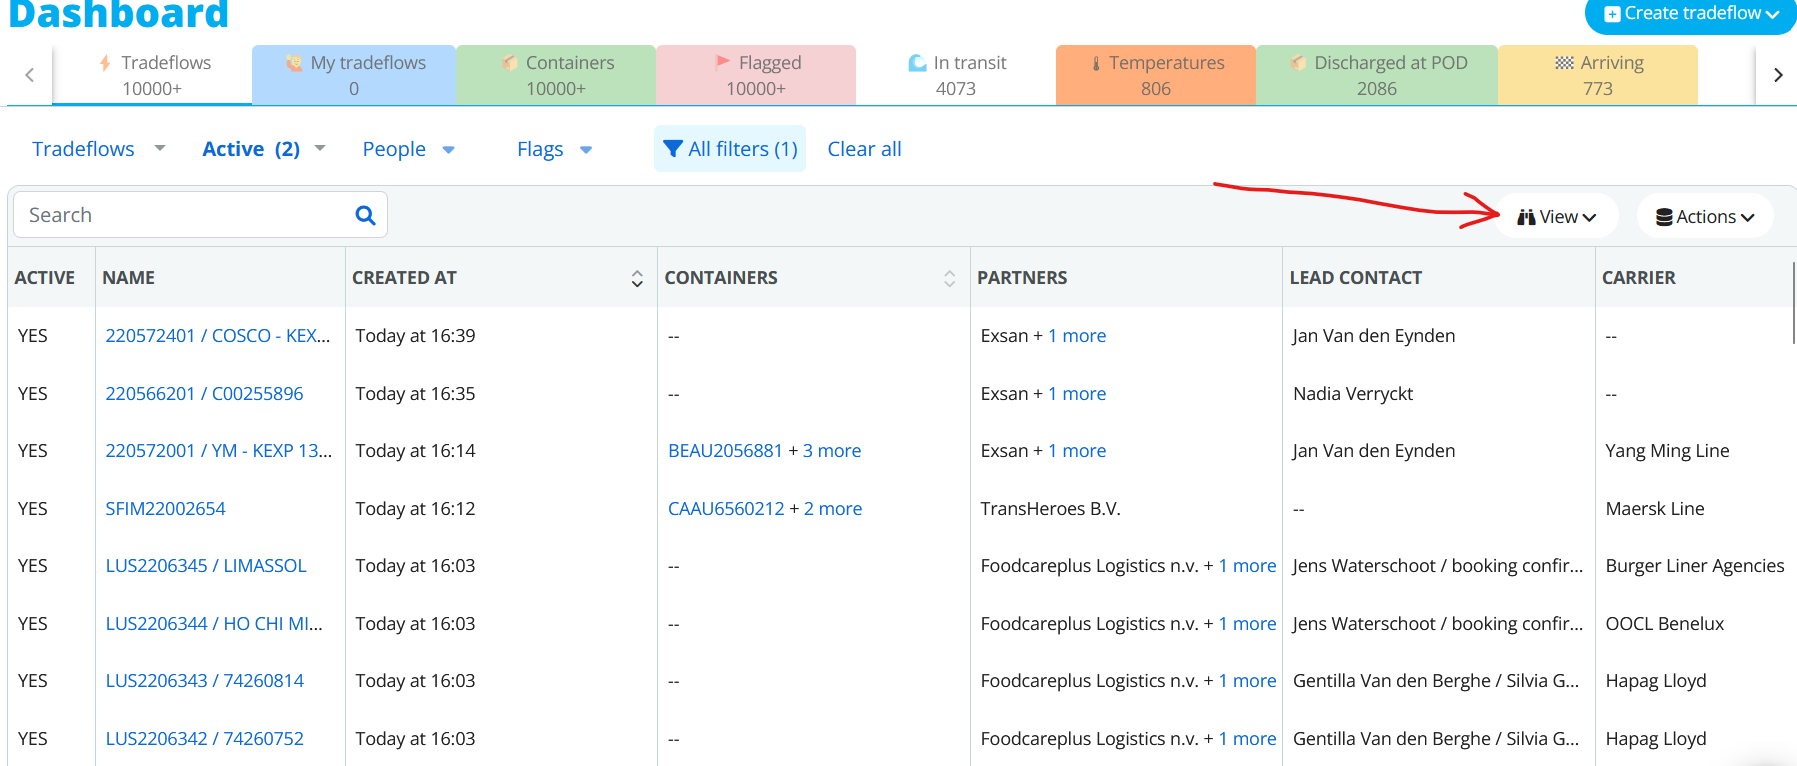 Figure 10: Edit columns interface
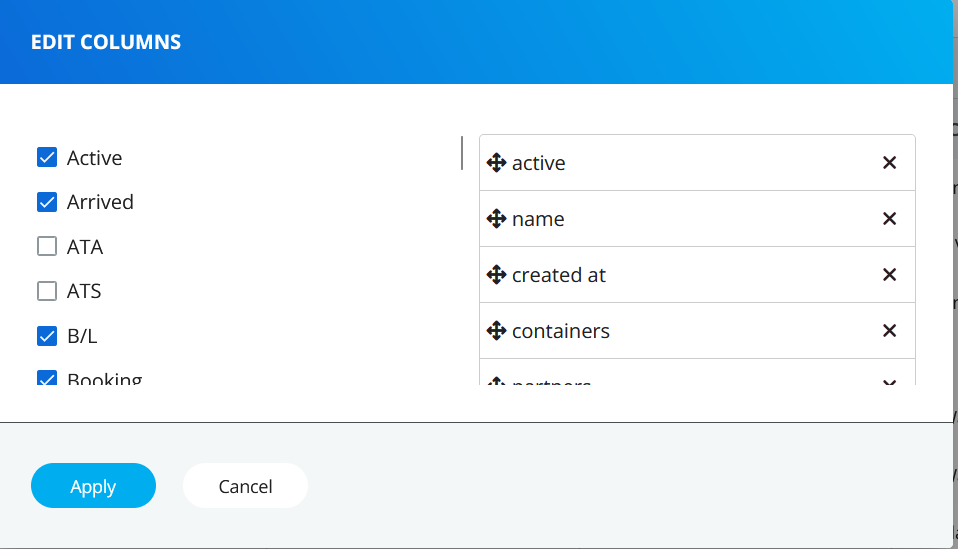 Figure 11: Configure which columns to display
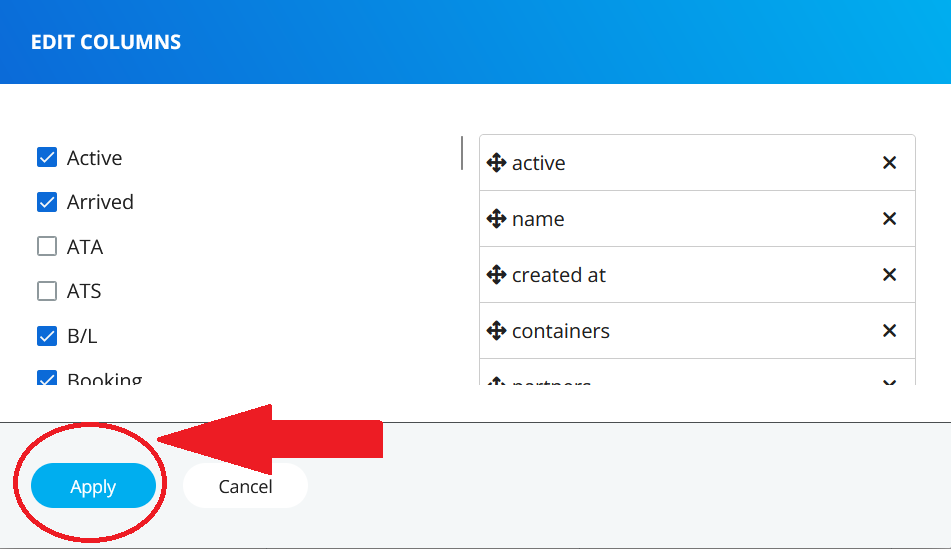 Figure 12: Apply column changes
Creating Custom Views
Save your column configurations and filters as reusable views:
- Click the View menu
- Select "Save & Edit view"
- Configure your columns and filters
- Give your view a descriptive name
- Click Save
Your custom view will now appear in the Views dropdown for quick access.
Example custom views:
- "Urgent - Arriving Today" - Only containers arriving today
- "My Temperature Cargo" - Your refrigerated shipments
- "Partner XYZ Shipments" - All shipments with a specific partner
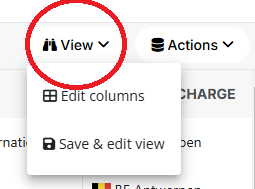 Figure 13: Access the View menu
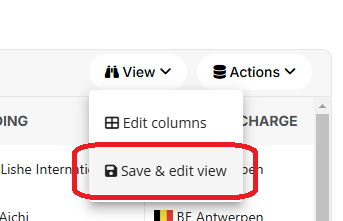 Figure 14: Save & Edit view option
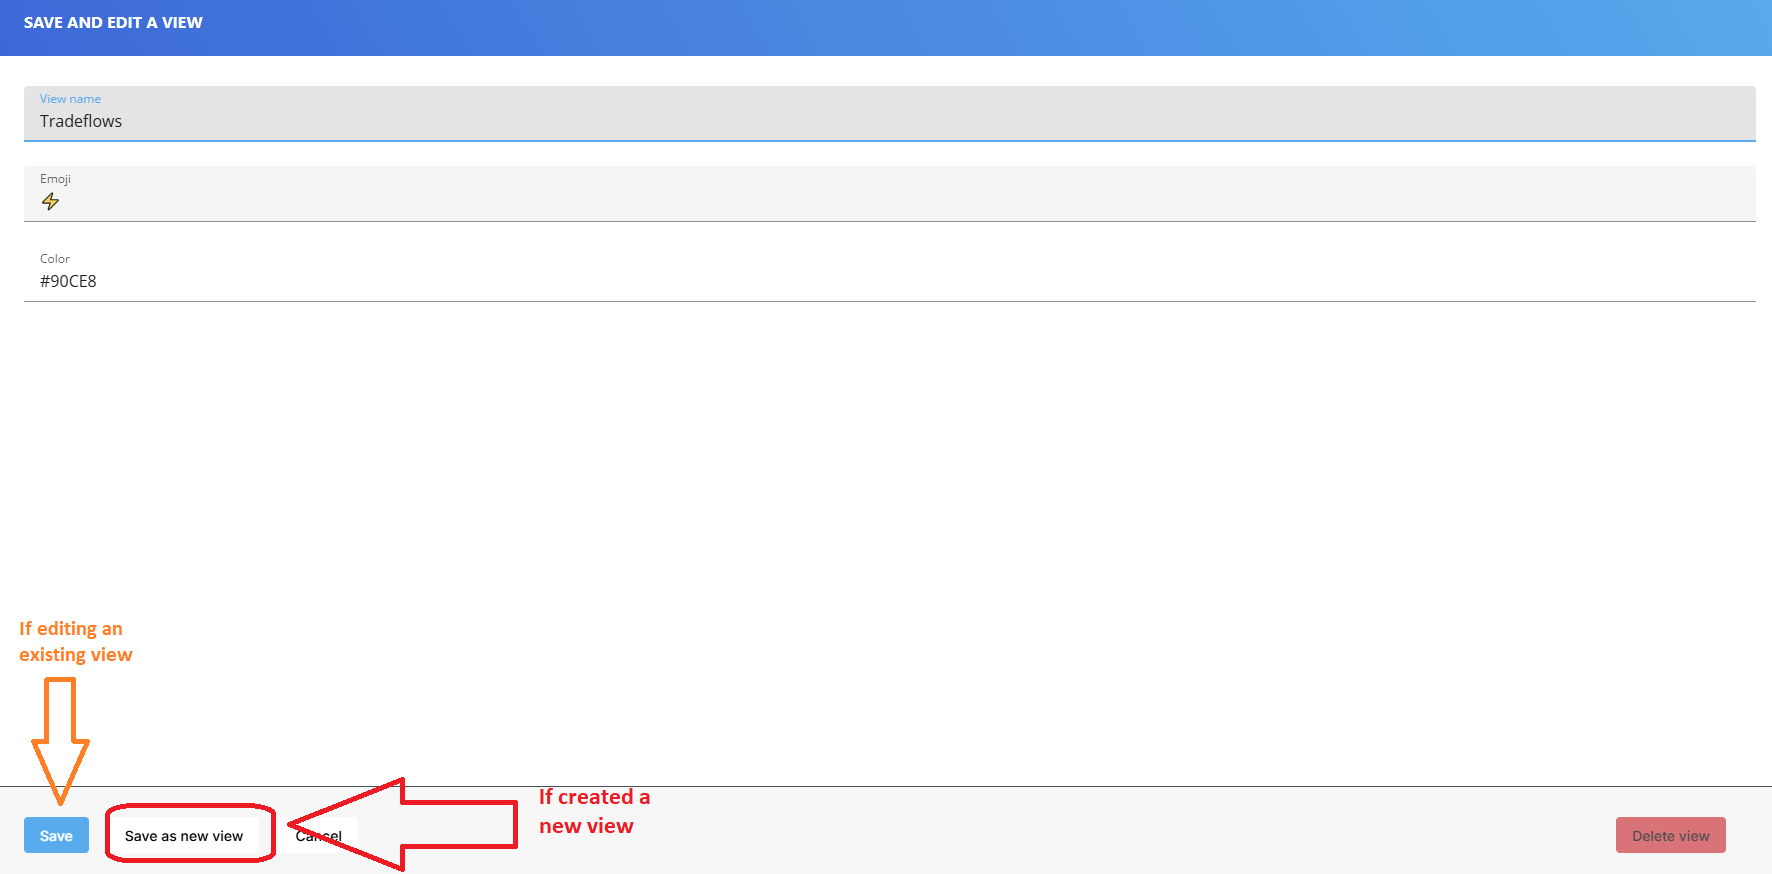 Figure 15: Name and save your custom view
Filtering
Apply multiple filters to narrow down your view:
Available filters:
- Partners - Filter by business partners or forwarders
- Flags - Show only flagged shipments
- Type - Filter by shipment type (FCL, LCL, air, etc.)
- Active/Inactive status - Show only active or archived shipments
- Date ranges - Filter by departure, arrival, or creation dates
- Ports - Filter by origin or destination port
How to use filters:
- Click the Filter button (usually near the search bar)
- Select your filter criteria
- Click Apply
- View filtered results
Clear filters:
- Click Clear all in the filter bar
- Or click the X next to individual filter tags
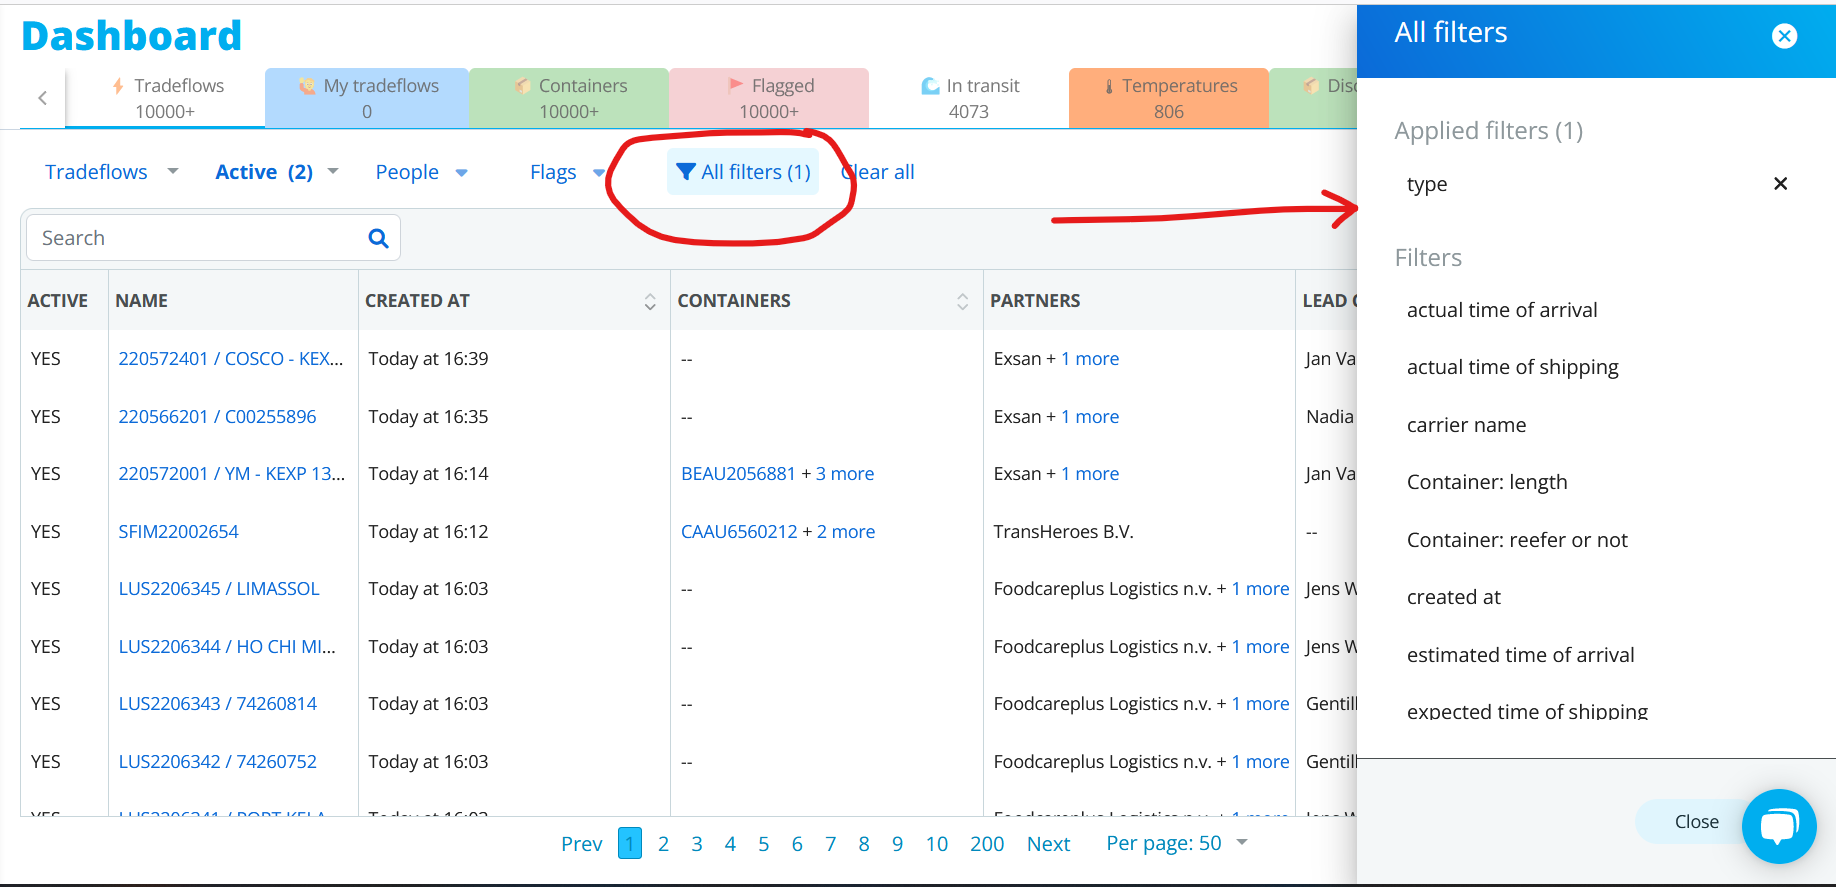 Figure 16: Filter editing and management interface
Tips for Effective Dashboard Use
Combine Views and Filters
Use views for persistent configurations and filters for temporary focus:
Example workflow:
- Start with "My Tradeflows" view
- Apply filter for "Arriving this week"
- Add filter for Flags to see only flagged shipments
- Address issues
- Clear filters to return to full view
Save Common Filter Combinations
If you frequently use the same filter combination:
- Apply your filters
- Save as a custom view
- Reuse instantly from the Views dropdown
Use Multiple Tabs
Open multiple dashboard views in separate browser tabs:
- Tab 1: "Arriving Today" - Check hourly
- Tab 2: Flags — Monitor automation-driven flags
- Tab 3: "All Tradeflows" - Reference view
Keyboard Shortcuts
Speed up your workflow with keyboard shortcuts:
/- Focus search barEsc- Clear search or close modals- Arrow keys - Navigate between rows
Enter- Open selected tradeflow
(Check the help menu for a complete list of shortcuts)
Next Steps
- Learn about automations - Getting Started with Automations
- Create custom flags - Set up automated alerts for your team
- Export data - Download dashboard data for reporting
Need Help?
- In-app tour - Click the help icon for an interactive dashboard tour
- Video tutorials - Dashboard walkthrough videos (coming soon)
- Email support - [email protected]
Migrated from: https://support.dockflow.com/using-the-dashboard Last updated: January 28, 2026